
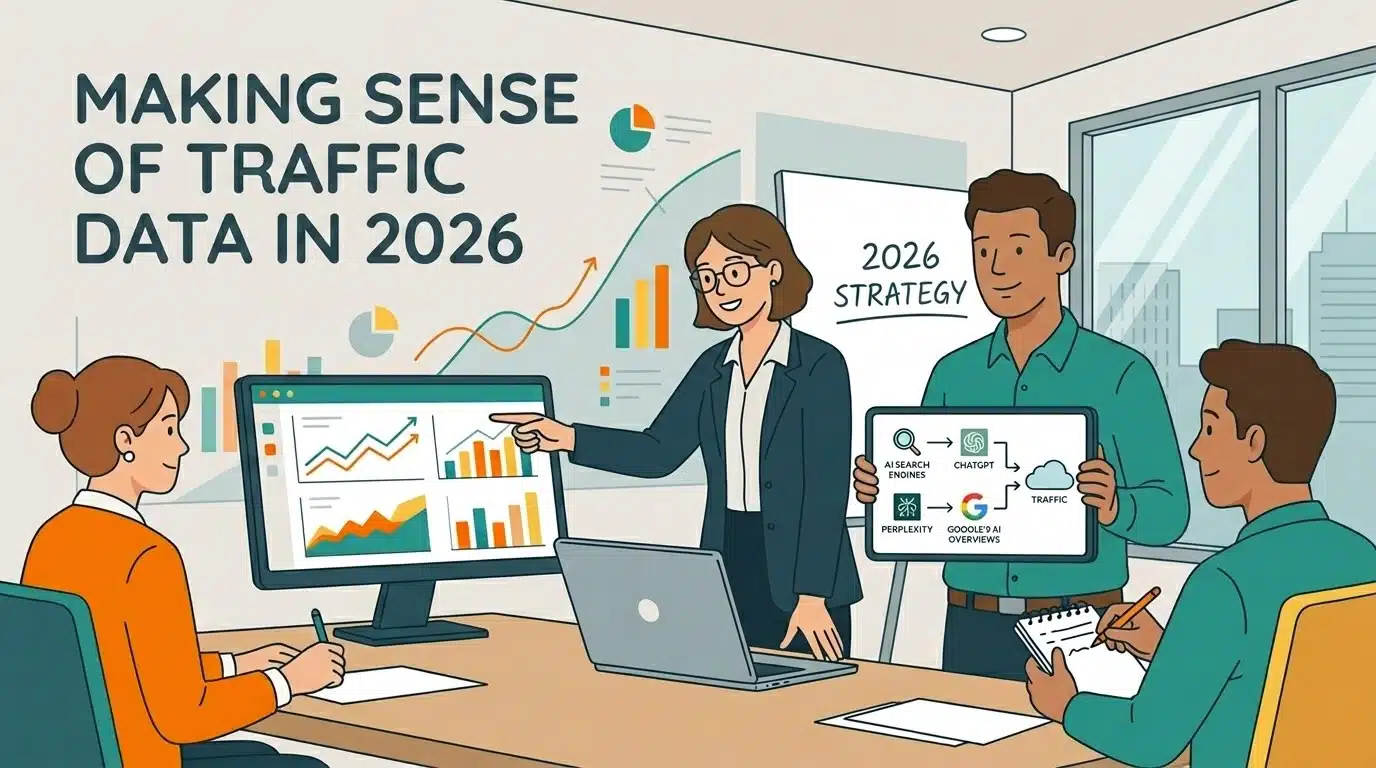
Most B2B teams have a Google Analytics login, three half-built dashboards somebody started two quarters ago, and zero confidence in what any of it actually means. (If that's you, you're absolutely not alone. It's almost a rite of passage.)
The hard part isn't getting traffic data. It's making sense of it: knowing which numbers actually matter, which ones are flattering noise, and what to do once you've found a pattern. And in 2026, the rules are shifting. AI search engines like ChatGPT, Perplexity, and Google's AI Overviews are quietly redirecting some of your traffic, hiding some of your referrers, and changing what "traffic" even means.
This guide walks through it. We'll cover what website traffic analysis is, the metrics that move the needle for B2B specifically, a 5-step framework for running an analysis without losing a weekend, the AI search layer most teams are missing, the tools to use (the free ones go a long way), and three real-world scenarios showing what this looks like in practice.
What is website traffic analysis?
Website traffic analysis is the process of reviewing how visitors find, use, and convert on your website, then turning what you find into decisions about your marketing, content, and product.
A complete traffic analysis answers five questions:
- Where is the traffic coming from? Organic search, paid search, social, email, referral, direct, or AI search.
- What are visitors doing on the site? Which pages, how long, what actions they take.
- Who's converting and who isn't? Segmented by source, device, page, and behavior.
- Why is performance changing? Up, down, or sideways since last month or last quarter.
- What should we do next? Specific, measurable actions, not vague intentions.
If your current analysis stops at "we got 12,000 visitors last month," you're not analyzing traffic. You're counting it.
The metrics that actually matter for B2B
You could track 100+ things in GA4. Don't.
For B2B specifically (long sales cycles, complex buying committees, smaller traffic volumes than B2C), most of the value lives in maybe a half-dozen metrics. Here's where to focus:
Sessions vs. users. Users are unique humans. Sessions are visits. A high sessions-to-users ratio means people are coming back, which is usually a good sign for B2B (research-heavy buying behavior). A flat ratio means one-and-done traffic that isn't sticking.
Engagement rate (not bounce rate). GA4 replaced the old bounce rate with engagement rate, which is more useful. An engaged session is one that lasts more than 10 seconds, has a conversion event, or includes at least two pageviews. Aim for 50%+ as a rough baseline. Engagement rate by source tells you which channels bring people who actually pay attention.
Conversion rate by source. This is where B2B analysis earns its keep. A traffic source bringing 1,000 visitors at 1% conversion is less valuable than one bringing 100 visitors at 10%. Always look at conversion in the context of source. Aggregate averages hide the truth.
Pipeline-per-session (and revenue-per-session). If you can connect GA4 (or HubSpot Analytics) to your CRM, this is the single most useful B2B metric: which traffic sources actually create pipeline, and which create revenue. Most teams don't have this set up. Most teams should.
Lifetime value by acquisition channel. Even more useful than revenue-per-session. The traffic source with the highest first-deal conversion isn't always the one that brings customers who stick around.
The vanity metrics to (mostly) ignore. Total page views without context, blanket session duration averages, social shares disconnected from outcomes, anything that goes up and to the right with no explanation. They feel good. They don't drive decisions.
A 5-step framework for analyzing your traffic
Most traffic analysis projects either die in the spreadsheet or spiral into "let's track everything." This framework prevents both. Run it monthly for big-picture insight, weekly for tactical campaigns, and ad-hoc when something looks off.
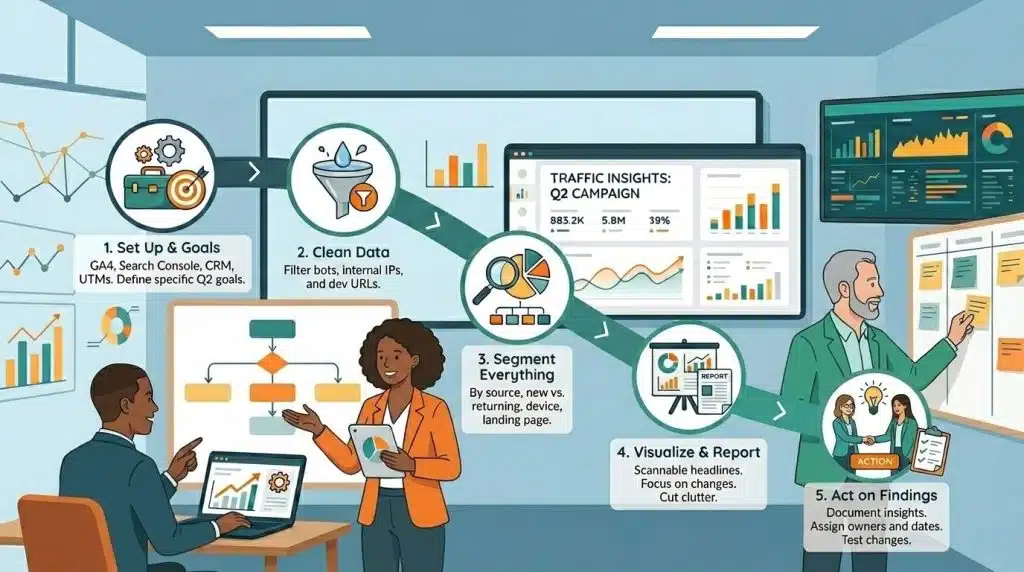
Step 1: Set up your stack and your goals
Two things have to be true before any analysis: your tracking actually works, and you know what you're trying to learn.
For tracking: at minimum, GA4 with conversions configured (not just pageviews), Google Search Console connected to GA4, and HubSpot or your CRM tied in if you have one. UTM parameters on every campaign — basic, I know, but most teams have at least one channel that's been wide-open since 2023.
For goals: get specific. "Increase traffic" isn't a goal. "Increase qualified-lead conversions from organic search by 20% in Q2" is. Without a clear question, you'll wander dashboards forever and learn nothing.
Step 2: Clean your data
Raw analytics data is messy. Three things to filter before you analyze:
- Bot traffic. GA4 filters most automatically; your CRM probably doesn't. Internal IPs and known bot user agents both need exclusion rules.
- Internal company traffic. Your team's own visits should be filtered out. (You'd be amazed how many "engaged users" are your sales team checking the pricing page.)
- Dev and staging URLs. Make sure tracking is only running on production.
Five minutes of filtering saves five hours of "wait, this can't be right."
Step 3: Segment everything
Aggregate numbers lie. Segmentation tells the truth.
The segmentations that matter most for B2B:
- By traffic source. Always. Always. Always.
- New vs. returning visitors. New tells you what marketing is doing. Returning tells you whether your content is worth coming back to.
- By device. B2B traffic skews desktop, but mobile is increasingly where research happens.
- By landing page. Your top 10 entry points usually tell you 80% of the story.
- By geography. Especially if you sell into specific regions.
If you only segment one way, segment by source. The patterns hidden inside "all traffic" are almost always the answer to whatever question you're trying to ask.
Step 4: Visualize and report
Make it scannable. Whoever's reading the report (you, your boss, the board) should be able to pull the headline in 30 seconds.
A few rules I've earned the hard way: One headline per dashboard — if you've got eight insights, you've got no insights. Lead with what changed and why, not the absolute numbers. Cut every chart that doesn't drive a decision.
Looker Studio is free, plugs directly into GA4 and Search Console, and is more than enough for most B2B teams. HubSpot Analytics is great if you're in the HubSpot ecosystem because it connects traffic to actual revenue.
Step 5: Act on what you found
This is the step where most analyses go to die.
Document what changed, why, and what you're going to do about it. Then actually do it. A simple format works: for each insight, write one sentence about what you saw, one about what's likely causing it, and one about what you're going to test or change. Anything that doesn't get assigned to a person with a date isn't a real conclusion. It's a feeling.
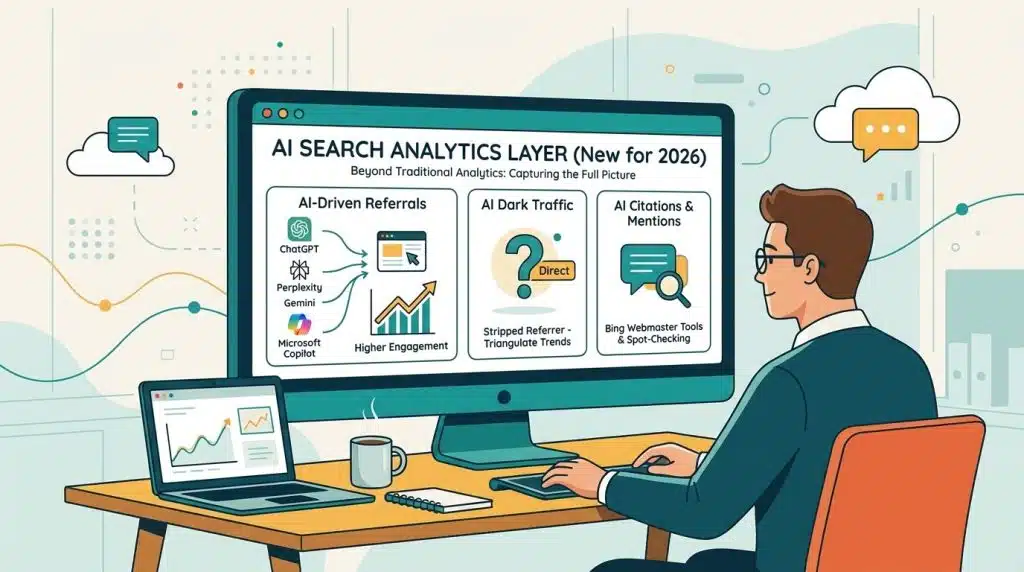
The AI search analytics layer (new for 2026)
Here's the part nobody talked about three years ago.
In 2026, a meaningful chunk of your "traffic" isn't coming from Google search results anymore. It's coming from AI engines — ChatGPT, Perplexity, Gemini, Microsoft Copilot — that read content from your site and surface it in their answers. Sometimes they cite you (with a clickable link). Sometimes they don't (zero-click). Either way, your traditional analytics aren't going to capture the full picture.
Three things worth tracking specifically:
1. AI-driven referrals. Set up GA4 to recognize traffic from chatgpt.com, perplexity.ai, gemini.google.com, copilot.microsoft.com, and a handful of others as their own channel group. (They typically show up as "referral" by default, which buries them in the noise.) Once configured, you can watch which AI engines actually send you visitors and how that traffic behaves compared to organic search. Spoiler: it usually has a higher engagement rate. People who arrive via AI recommendation tend to be more qualified.
2. AI dark traffic. Some AI-driven visits show up as "direct" in GA4 because the AI engine strips the referrer. If you're seeing direct traffic spike with no obvious explanation (no print campaign, no podcast, no offline mention), it's probably AI-driven. The fix isn't perfect, but you can triangulate: compare your direct traffic trends against your brand search volume in GSC and any new AI citations you can find for your content.
3. AI citations and brand mentions. Two free tools matter. Bing Webmaster Tools has an AI Search Queries report that shows queries triggering AI citations to your site. (Microsoft surfaces this; Google does not, at least not yet.) And spot-checking your priority queries directly in ChatGPT and Perplexity tells you whether you're showing up in answers for the questions your buyers actually ask. Neither dataset is perfect, but they're better than flying blind.
The honest take: nobody has this dialed in yet, including me. The landscape is still maturing. But the teams paying attention now will have a meaningful head start over the ones still treating AI search like a blip.
The tools you need (and the ones you don't)
A genuinely useful traffic analysis stack costs $0 to start.
The free essentials:
- Google Analytics 4 — sessions, events, conversions, the whole baseline
- Google Search Console — the only place to see your actual organic search query data
- Bing Webmaster Tools — Bing's version of GSC, plus the AI Search Queries report (worth setting up just for that)
- Microsoft Clarity — heatmaps and session recordings, free, no usage limits worth worrying about
- Looker Studio — for combining all of the above into one dashboard
That's the whole free stack. It covers 90% of what a mid-market B2B team actually needs.
Worth paying for, sometimes:
- HubSpot Analytics, if you're already on HubSpot. Connects traffic to deals and revenue, which is what you actually care about as a B2B marketer.
- A heatmap tool with longer data retention (Hotjar's a common choice) if Clarity doesn't go back far enough for you.
- A data warehouse and attribution platform — but only if you've genuinely outgrown Looker Studio. Most teams haven't.
What you can usually skip:
- "Enterprise" analytics platforms that promise to replace GA4. Expensive and unnecessary for most B2B teams.
- Standalone "AI traffic tracking" tools that have appeared in the last 18 months. Most are reinventing what GA4, GSC, and Bing Webmaster do for free.
If you're rebuilding your tooling, it's worth pairing this with our content audit best practices — knowing your traffic patterns is most useful when you also know what content is actually performing.
Real examples: what traffic analysis looks like in practice
Three scenarios drawn from common patterns we see with B2B clients. Composite cases, but the patterns are real.
Scenario 1: The traffic drop that wasn't a traffic drop
A B2B SaaS company saw organic traffic drop 35% in March. Panic mode. Initial theory: Google algorithm update.
Real cause: their highest-traffic landing page had been updated by a freelancer who removed the FAQ schema and changed the H1. The page lost its featured snippet and dropped from position 3 to position 9 for its top keyword. Other pages were fine. The "site-wide" drop was actually one page's drop showing up on the aggregate dashboard.
Fix: restored the FAQ schema, reverted the H1, monitored weekly. Recovered to within 5% of original traffic over six weeks.
Lesson: segment by landing page before you segment by anything else. Aggregate "organic traffic" hides which page is actually broken.
Scenario 2: Traffic up, pipeline flat
A B2B manufacturer saw organic traffic grow 60% over six months. Their CMO loved it. Their CRO was frustrated — pipeline hadn't moved.
Analysis: 80% of the new traffic came from a single high-ranking blog post that had gone viral on LinkedIn. The post drove enormous awareness traffic, but the visitors weren't ICP. They were freelancers and small-business owners curious about a topic adjacent to the company's actual product. Conversion rate from that post: 0.2%, against a site average of 4%.
Fix: stopped pretending the spike meant business growth. Started tracking engaged sessions and conversions by source instead of just total traffic. The blog post stayed up (good for brand authority), but the team stopped treating its traffic as a leading indicator of pipeline.
Lesson: traffic without conversion isn't traffic worth celebrating. Always layer source quality on top of source volume.
Scenario 3: Direct traffic doubled. What's going on?
A B2B services firm noticed direct traffic doubled in late 2025. They hadn't run any new offline campaigns, podcast appearances, or brand campaigns to explain it.
Analysis: cross-referenced direct traffic against their AI citations. Their content was being cited in answers from Perplexity and ChatGPT for several priority queries. Most of the new "direct" visits had no referrer because the AI engines were stripping it.
Fix: built out FAQ-driven content for the queries they were already getting cited on. Started monitoring AI citations weekly via Bing Webmaster Tools and manual spot-checks. Started treating AI search as its own acquisition channel rather than a noise variable in their direct traffic.
Lesson: unexplained direct traffic in 2026 is often AI traffic. Investigate before you celebrate.
Frequently asked questions
A complete traffic analysis covers five things: where your traffic comes from (channels and sources), what visitors do on the site (pages viewed, engagement, conversions), who's converting (segmented by source, device, behavior), why performance is changing (compared to the prior period or baseline), and what to do about it. Anything less than that is just data review.
For B2B specifically: engagement rate by source, conversion rate by source, pipeline-per-session (if you can tie analytics to your CRM), lifetime value by acquisition channel, and new-vs-returning visitor ratio. Skip the vanity metrics — total page views without context, session duration averages, social share counts disconnected from outcomes. Page views feel productive. They don't tell you anything actionable.
A few ways. Some traffic that used to come from Google search results now arrives via AI engines (ChatGPT, Perplexity, Gemini, Copilot), either as referrals or as "direct" traffic with the referrer stripped. In other cases, some queries are being answered by AI without a click at all (zero-click), which means impressions go up while clicks stay flat. Some content gets cited in AI answers without your knowing it. The honest answer: AI search is changing the picture, no one has it perfectly measured yet, and it's worth setting up basic tracking so you're not surprised six months from now.
Three rhythms work for most B2B teams. Weekly: a quick check on big movements, anything up or down 20%+ that needs investigating. Monthly: a deep dive into segmentation, source quality, and what the trends mean. Quarterly: strategic review, connecting traffic patterns to pipeline and revenue, deciding what to invest in or cut. The mistake most teams make is doing daily reviews (too noisy) or only quarterly ones (too slow to catch problems). Find the cadence in between.
The takeaway
The point of website traffic analysis isn't to fill a dashboard. It's to make better decisions about your marketing — what's working, what's wasting money, and what to do next.
In 2026, that means tracking the new stuff (AI search, dark traffic, AI citations) without ignoring the basics (engagement, conversion by source, source quality). The teams getting the most out of their analytics aren't the ones with the fanciest tools or the most dashboards. They're the ones running a clear monthly cadence, asking specific questions, and shipping actual changes based on what they find.
If your current analysis stops at the absolute numbers ("we got 12K visitors") rather than the implications ("our LinkedIn traffic converts 3x better than our paid search traffic, so we should rebalance budget"), you've got room to grow.
We help mid-market B2B companies set up traffic analysis that actually drives decisions, usually inside HubSpot. If you're stuck somewhere along the way, we'd be happy to help. And for related reading, our guides to content audit best practices and B2B digital marketing ideas cover adjacent topics that pair well with this one.